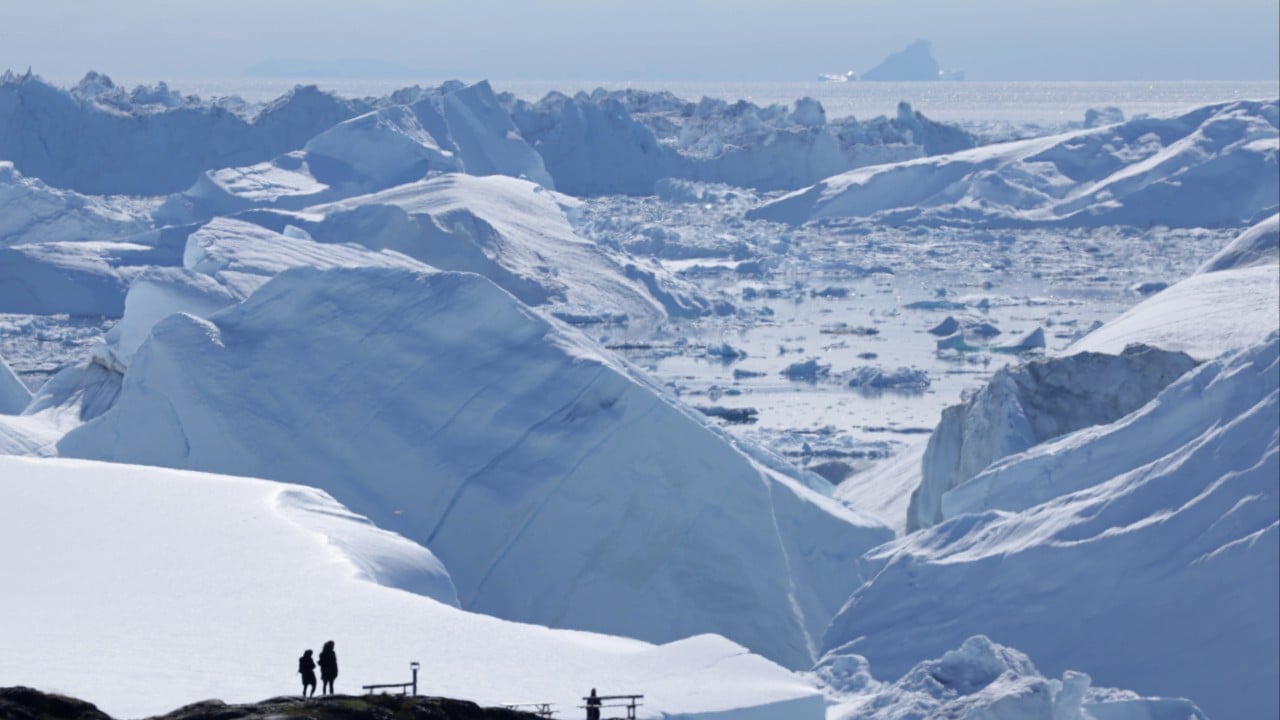
Stand at the edge of the Ilulissat Icefjord in western Greenland in July, and you will hear the sound of a continent tearing itself apart.
It does not sound like water. It sounds like artillery. A sharp, rifle-crack echo rolls across the gray water, followed seconds later by a low, subterranean groan that vibrates through the soles of your boots. Then, a wall of ancient, compressed blue ice the size of a city block shears off the Sermeq Kujalleq glacier and plunges into the fjord, sending a six-foot swell racing toward the rocks where you are standing.
Watching it happen with your own eyes makes the math seem absurdly simple. The ice is melting. The ocean is rising. You can see it, hear it, and feel the spray on your face.
Yet thousands of miles away, in quiet, fluorescent-lit laboratories in Beijing and Washington, D.C., two teams of brilliant scientists are looking at that exact same sheet of ice—and arriving at wildly different conclusions about how fast it is disappearing.
In a major study that sent ripples through the climate community, Chinese researchers unveiled a new calculation of Greenland’s ice loss speed. Their number was a staggering 55 percent lower than the prevailing American estimates.
Fifty-five percent. That is not a rounding error. That is the difference between a coastal city building a seawall over the next three decades and a coastal city packing its bags tomorrow. When headlines blared that China’s estimate on Greenland ice loss was more than half below America’s, the public reaction was predictable. Skeptics claimed climate science was broken. Alarmists accused Beijing of cooking the books to downplay global warming.
Both sides missed the real story.
To understand how two superpowers can measure the same physical object and disagree by more than half, you have to step away from geopolitics and step onto the scales. Because at its core, this is not a story about political bias. It is a story about the staggering, almost impossible difficulty of weighing a moving, breathing, groaning block of ice from space—and what happens to the rest of us when the rulers do not match.
The Invisible Scale Above the Arctic
Imagine—and let us be clear, this is a mental picture to make sense of orbital physics—trying to weigh a melting ice cube sitting on a sponge inside a moving elevator, while you are standing on the roof of the building using a pair of binoculars.
That is essentially what satellite geodesy does every single day.
For more than twenty years, the gold standard for measuring Greenland’s ice sheet has been a pair of American-German twin satellites known as GRACE, followed by GRACE-FO (Gravity Recovery and Climate Experiment Follow-On). These spacecraft do not take photographs of the ice. Instead, they chase each other around the Earth, separated by about 137 miles, firing microwave beams back and forth to measure the microscopic distance between them.
When the lead satellite flies over a massive concentration of mass—like the two-mile-thick Greenland ice sheet—gravity pulls it slightly forward, widening the gap between the two craft. As the ice melts and flows into the ocean, Greenland loses mass. Its gravitational pull weakens. The gap between the satellites shifts by a fraction of the width of a human hair.
From those hair-breadth twitches, American institutions like NASA and the Jet Propulsion Laboratory have long calculated that Greenland is shedding roughly 270 to 280 billion metric tons of ice every single year.
Enter the Chinese research team. Using an alternative methodology—combining satellite altimetry, which bounces laser or radar pulses off the surface of the ice to measure its height, alongside different modeling for atmospheric snowfall and glacial dynamics—their calculations yielded a figure roughly 55 percent lower than the headline American mass-loss rate over a specific comparative window.
Wait. How can height and gravity tell two such different stories?
Think of a loaf of bread baking in reverse. If you pull fresh, fluffy snow out of the sky and pack it onto the top of Greenland, the height of the ice sheet goes up. A laser bouncing off the surface sees a taller ice sheet and thinks, Great, we are gaining ice. Meanwhile, deep beneath the surface, warm ocean currents are eating away at the underbelly of the glaciers, hollowing them out like rotten teeth. The surface looks high, light, and fluffy, while the dense, heavy ancient ice underneath is vanishing into the Atlantic.
Or consider the bedrock itself.
Greenland is not a rigid table. The Earth’s crust beneath the ice is elastic, like a memory-foam mattress. For ten thousand years, the unimaginable weight of the ice sheet pressed the land down into the mantle. Now, as that weight lifts, the bedrock is slowly springing back upward—a process scientists call glacial isostatic adjustment.
To a satellite measuring gravity, rising rock looks almost identical to growing ice. Both add mass beneath the spacecraft. If your mathematical model overestimates how fast the rock is bouncing back, you will subtract too much mass from your final tally, making the ice loss look far worse than it is. If your model underestimates the rebound, the ice loss suddenly looks 55 percent smaller.
A Tale of Two Coastlines
Numbers in a peer-reviewed journal feel abstract until you watch them dictate the fate of real dirt and concrete.
Consider a hypothetical scenario—a composite built from real municipal planning debates happening right now on opposite sides of the planet.
Meet Sarah, a civil engineer working for a coastal municipality in Norfolk, Virginia, where the land is sinking at the exact same time the sea is rising. Every Tuesday morning, Sarah sits in a windowless conference room with city bond underwriters and urban planners. Her job is to decide how high to build the next generation of storm-surge gates.
If Sarah uses the higher American estimates of Greenland ice loss—roughly 280 billion tons a year, accelerating—her hydraulic models tell her that the city needs to spend an extra $400 million now to raise the concrete walls by three feet. If she gets it wrong and builds too low, a single Category 3 hurricane in 2045 turns downtown Norfolk into an uninhabitable lagoon.
Now fly nine thousand miles west to the Pearl River Delta in southern China, where Chen, a port logistics director in Guangzhou, is staring at the exact same spreadsheet problem. His terminals handle millions of shipping containers a year, sitting just feet above the South China Sea.
If Chen’s planners rely on a curve where Greenland’s contribution to sea-level rise is 55 percent slower than feared, the timeline stretches out. Capital that would have been poured into emergency sea walls can instead be routed into automated cranes, high-speed rail links, and immediate economic expansion. Buying thirty extra years of breathing room is worth tens of billions of dollars in freed-up infrastructure capital.
Sarah and Chen have never met. Neither of them is a climate denier. Both of them are trying to protect the people who live behind their seawalls. Yet because two groups of physicists applied different corrections for bedrock rebound, snowfall density, and satellite drift, Sarah is preparing for a flood that Chen’s models say will arrive decades later.
Who is right?
The Trap of the Single Number
I spent years covering environmental policy before I realized my own biggest blind spot as a writer: I wanted a clean, single number. We all do. Human brains are wired for certainty. Tell us the bridge will hold ten tons, and we drive across. Tell us it might hold four and a half or it might hold ten depending on how you calculate steel fatigue, and we freeze at the on-ramp.
When China’s lower estimate hit the wires, it collided directly with that human craving for certainty.
Look closely at the mechanics of the discrepancy, and the mystery begins to dissolve—not into a conspiracy, but into a sobering lesson about scientific windows.
First, time frames matter enormously in glaciology. Greenland does not melt like an ice cube on a summer sidewalk; it breathes in jagged, multi-year cycles. Between 2013 and 2017, shifts in the North Atlantic Oscillation—a massive atmospheric pressure seesaw—brought cooler summers and heavy winter snows to parts of Greenland. During that specific window, ice loss slowed dramatically compared to the catastrophic melt years of 2012 and 2019. When a study isolates or weights a specific temporal window, or measures net surface mass balance versus total dynamic discharge, the headline percentage shifts wildly.
Second, there is the question of what is actually being counted.
Greenland loses ice in two distinct ways. The first is surface melt: the sun shines, the air warms, and rivers of turquoise meltwater carve canyons through the ice and pour off the edges. The second is dynamic discharge: giant glaciers, lubricated by meltwater at their bases, slide faster toward the sea and calve off as icebergs.
Satellite altimetry—measuring height—is brilliant at tracking surface melt and winter snowfall. Gravity satellites like GRACE are better at catching the total mass leaving the island, including the massive chunks calving off into deep fjords where lasers struggle to see clearly through coastal clouds and steep canyon walls.
When you reconcile those two measurement systems, you realize the Chinese study did not "disprove" melting. Even a 55 percent lower estimate still means Greenland is losing well over a hundred billion tons of ice every single year.
Pause and picture that weight. One hundred billion metric tons of water is enough to cover the entire state of New York in more than two feet of water. Every year. Even in the most optimistic, lowest-estimate scenario on Earth, Greenland is still hemorrhaging water into the world’s oceans at a rate unmatched in human civilization.
Why the Disagreement Is Actually Good News
There is a dangerous temptation to view scientific friction as weakness. In reality, friction is the only reason science works at all.
For decades, Western climate models held a near-monopoly on global cryosphere data. NASA, the European Space Agency, and a handful of American universities built the satellites, wrote the algorithms, and published the consensus. When one group of researchers builds the tools, blind spots inevitably creep into the code. Everyone uses the same assumptions about snow compaction. Everyone applies the same bedrock rebound models. Consensus can quietly harden into groupthink.
China’s rapid ascent in Earth-observation science—launching its own gravity-field satellites, deploying autonomous polar stations, and running independent climate supercomputers—has shattered that monopoly.
When Beijing’s researchers publish a figure that challenges Pasadena’s numbers by 55 percent, they are forcing every glaciologist on the planet to tear open their code, re-examine their bedrock assumptions, and audit their satellite calibrations. Already, joint international working groups—like the Ice Sheet Mass Balance Inter-comparison Exercise (IMBIE)—exist specifically to throw Chinese, American, and European datasets into the same ring and see where they clash.
Sometimes, the clash exposes a flaw in the new model—for instance, failing to account for dense ice lenses forming beneath porous snow, which tricks radar altimeters into thinking the ice sheet is thicker than it really is. Other times, the clash forces the older American models to refine how they separate glacial rebound from true ice loss.
The truth does not live in the American press release, nor does it live in the Chinese abstract. It lives in the uncomfortable, fiercely debated space between them.
What Happens When the Ice Doesn't Care About Our Math
Back in Ilulissat, the local Inuit fishermen do not read papers on satellite gravimetry. They read the sea ice.
For generations, hunters in northern Greenland traveled across the frozen fjords by dogsled from October until May. The ice was a highway—thick, predictable, and solid enough to hold teams of dogs and heavy wooden sleds laden with halibut and seal.
Today, that highway rarely freezes solid before January, and by March it is already rotting from beneath, turned into treacherous slush by warm Atlantic water creeping north. Fishermen have had to trade their sleds for small aluminum boats, navigating maze-like channels choked with brash ice that can crush a hull in seconds.
Ask a fisherman in Ilulissat whether the ice is disappearing 55 percent slower than an American satellite says it is, and he will look at you as if you have asked him whether a house fire is burning slightly cooler in the kitchen than in the living room.
The house is still on fire.
That is the invisible trap hidden inside the 55 percent headline. In the arena of public opinion, nuance is lethal. If the public hears that one superpower’s scientists think Greenland is melting half as fast as the other superpower claimed, the instinctive human reaction is relief. We exhale. We postpone the hard choices. We tell ourselves we have time.
Yet physics does not negotiate with our attention spans, and ocean currents do not read comparative literature reviews. Whether Greenland dumps 125 billion tons of water into the North Atlantic this year or 280 billion tons, two brutal facts remain untouched by the debate:
First, the trajectory is accelerating. A slower starting slope on an exponential curve still ends up in the exact same place—it simply lulls you to sleep right up until the curve turns vertical.
Second, Greenland holds enough frozen water to raise global sea levels by roughly twenty-four feet. Nobody expects all twenty-four feet to vanish in our lifetimes. Even two or three feet, however, is enough to redraw the map of every coastal economy on Earth, from Miami to Shanghai, from Alexandria to Rotterdam.
When Sarah the engineer in Virginia and Chen the port director in Guangzhou sit down at their desks tomorrow morning, they do not have the luxury of waiting ten years for Beijing and Washington to harmonize their bedrock rebound equations. They have to pour concrete today against an ocean that is rising no matter whose math wins the argument.
Out on the water in Ilulissat, the swell from the calving glacier finally reaches the rocky shore. It hisses through the pebbles, soaking the cuffs of your trousers with water that fell as snow ten thousand years ago, before the pyramids were built, before writing was invented, before anyone had a name for China or America. The wave pulls back into the fjord, carrying tiny shards of crystal-clear ice that clink together like glass chimes in the dark water, drifting steadily, silently, toward the open sea.